Architecture Practices
Description
Before we get into a detailed discussion of architecture domains, let us talk in general about what architects do and some common practices and themes.
As we mentioned previously, architecture itself as a term shows up in many ways – as role, artifact, program, and organization.
In this Competency Category, we will look at:
-
The relationship of architecture and governance
-
Architecture as a management program
-
The importance of visualization as a practice in architecture
-
The IT lifecycles
-
Architecture and the quest for “rationalization”
Architecture and Governance
Enterprise Architecture has a clear relationship to governance as we discussed it in governance. It provides a framework for managing long lifecycle concerns and various forms of enterprise risk, especially as related to digital and IT systems.
Architecture is an important part of the governance equation. Architecture becomes the vehicle for technical standards that are essential risk controls; a risk management organization cannot achieve this alone.
Enterprise Architecture, therefore, may have a role in defining policies, especially at the mid-tier of the policy hierarchy – neither the highest enterprise principles, nor the most detailed technical standards, but rather policies and standards related to:
-
Choice of certain enterprise products expected to be heavily leveraged (e.g., common database and middleware products)
-
Design patterns for solving recurring requirements (e.g., user authentication, load balancing, etc.)
-
System of Record identification and enforcement
As discussed in policy hierarchy, there needs to be traceability from tactical standards to strategic codes and principles. The preference for a given database should not be a policy, but having a process that establishes such a preference would be; that is, a policy should exist saying, for example, “there shall be a Technology Lifecycle Management process with the following objectives and scope”. Where appropriate, such policies might also be linked to specific risks as controls or governance elements.
As for all policies, it is important to have some sort of sunset mechanism for Enterprise Architecture guidance. Enterprise Architecture plays a key role in Technology Lifecycle Management and adopting new technologies. More guidance in this matter can be found in TOGAF® Series Guide: Digital Technology Adoption: A Guide to Readiness Assessment and Roadmap Development [G212].
One issue to consider is that the overall benefits of having, for example, a Technology Lifecycle Management process are not usually quantified in terms of cost and risk avoidance. Without an overall governance mandate and value proposition, Enterprise Architecture activities may be seen as the response to the “issue of the moment”. This is not a recipe for sustainable architecture, whose most important value proposition lies in the long term. Architecture, as a component of coherent governance, requires no less.
As we discussed in Governance, Risk, Security, and Compliance governance emerges in part as a response to external forces. Architecture often plays a consultative role when external forces become governance issues; for example:
-
Data custody and System of Record, and relationship to records management
-
Vendor relationship strategies
-
Security risks and controls
Governance is also concerned with efficiency, which also becomes a key architecture concern with associated practices:
-
IT portfolio rationalization
-
Business process optimization
-
Shared services and APIs reuse
-
Master and reference data management
Finally, does Enterprise Architecture promote effectiveness? Effectiveness is often seen as the primary responsibility of “the line” in line/staff paradigms. However, as the impact model suggests, establishing a foundation of re-usability and limiting technical choices can increase the speed with which new products and services are delivered.
Architecture as a Management Program
The above section discussed the relationship of architecture to governance. As we covered in Governance, Risk, Security, and Compliance, governance is not management. Here, we will cover the topic of architecture as a management program of activity, in part through examining an example large-scale architecture program.
Architecture as a program refers to a coordinated set of:
-
Processes
-
Job roles
-
Standards and practices
-
Artifacts
-
Organizations
-
Cadenced and ad hoc activities
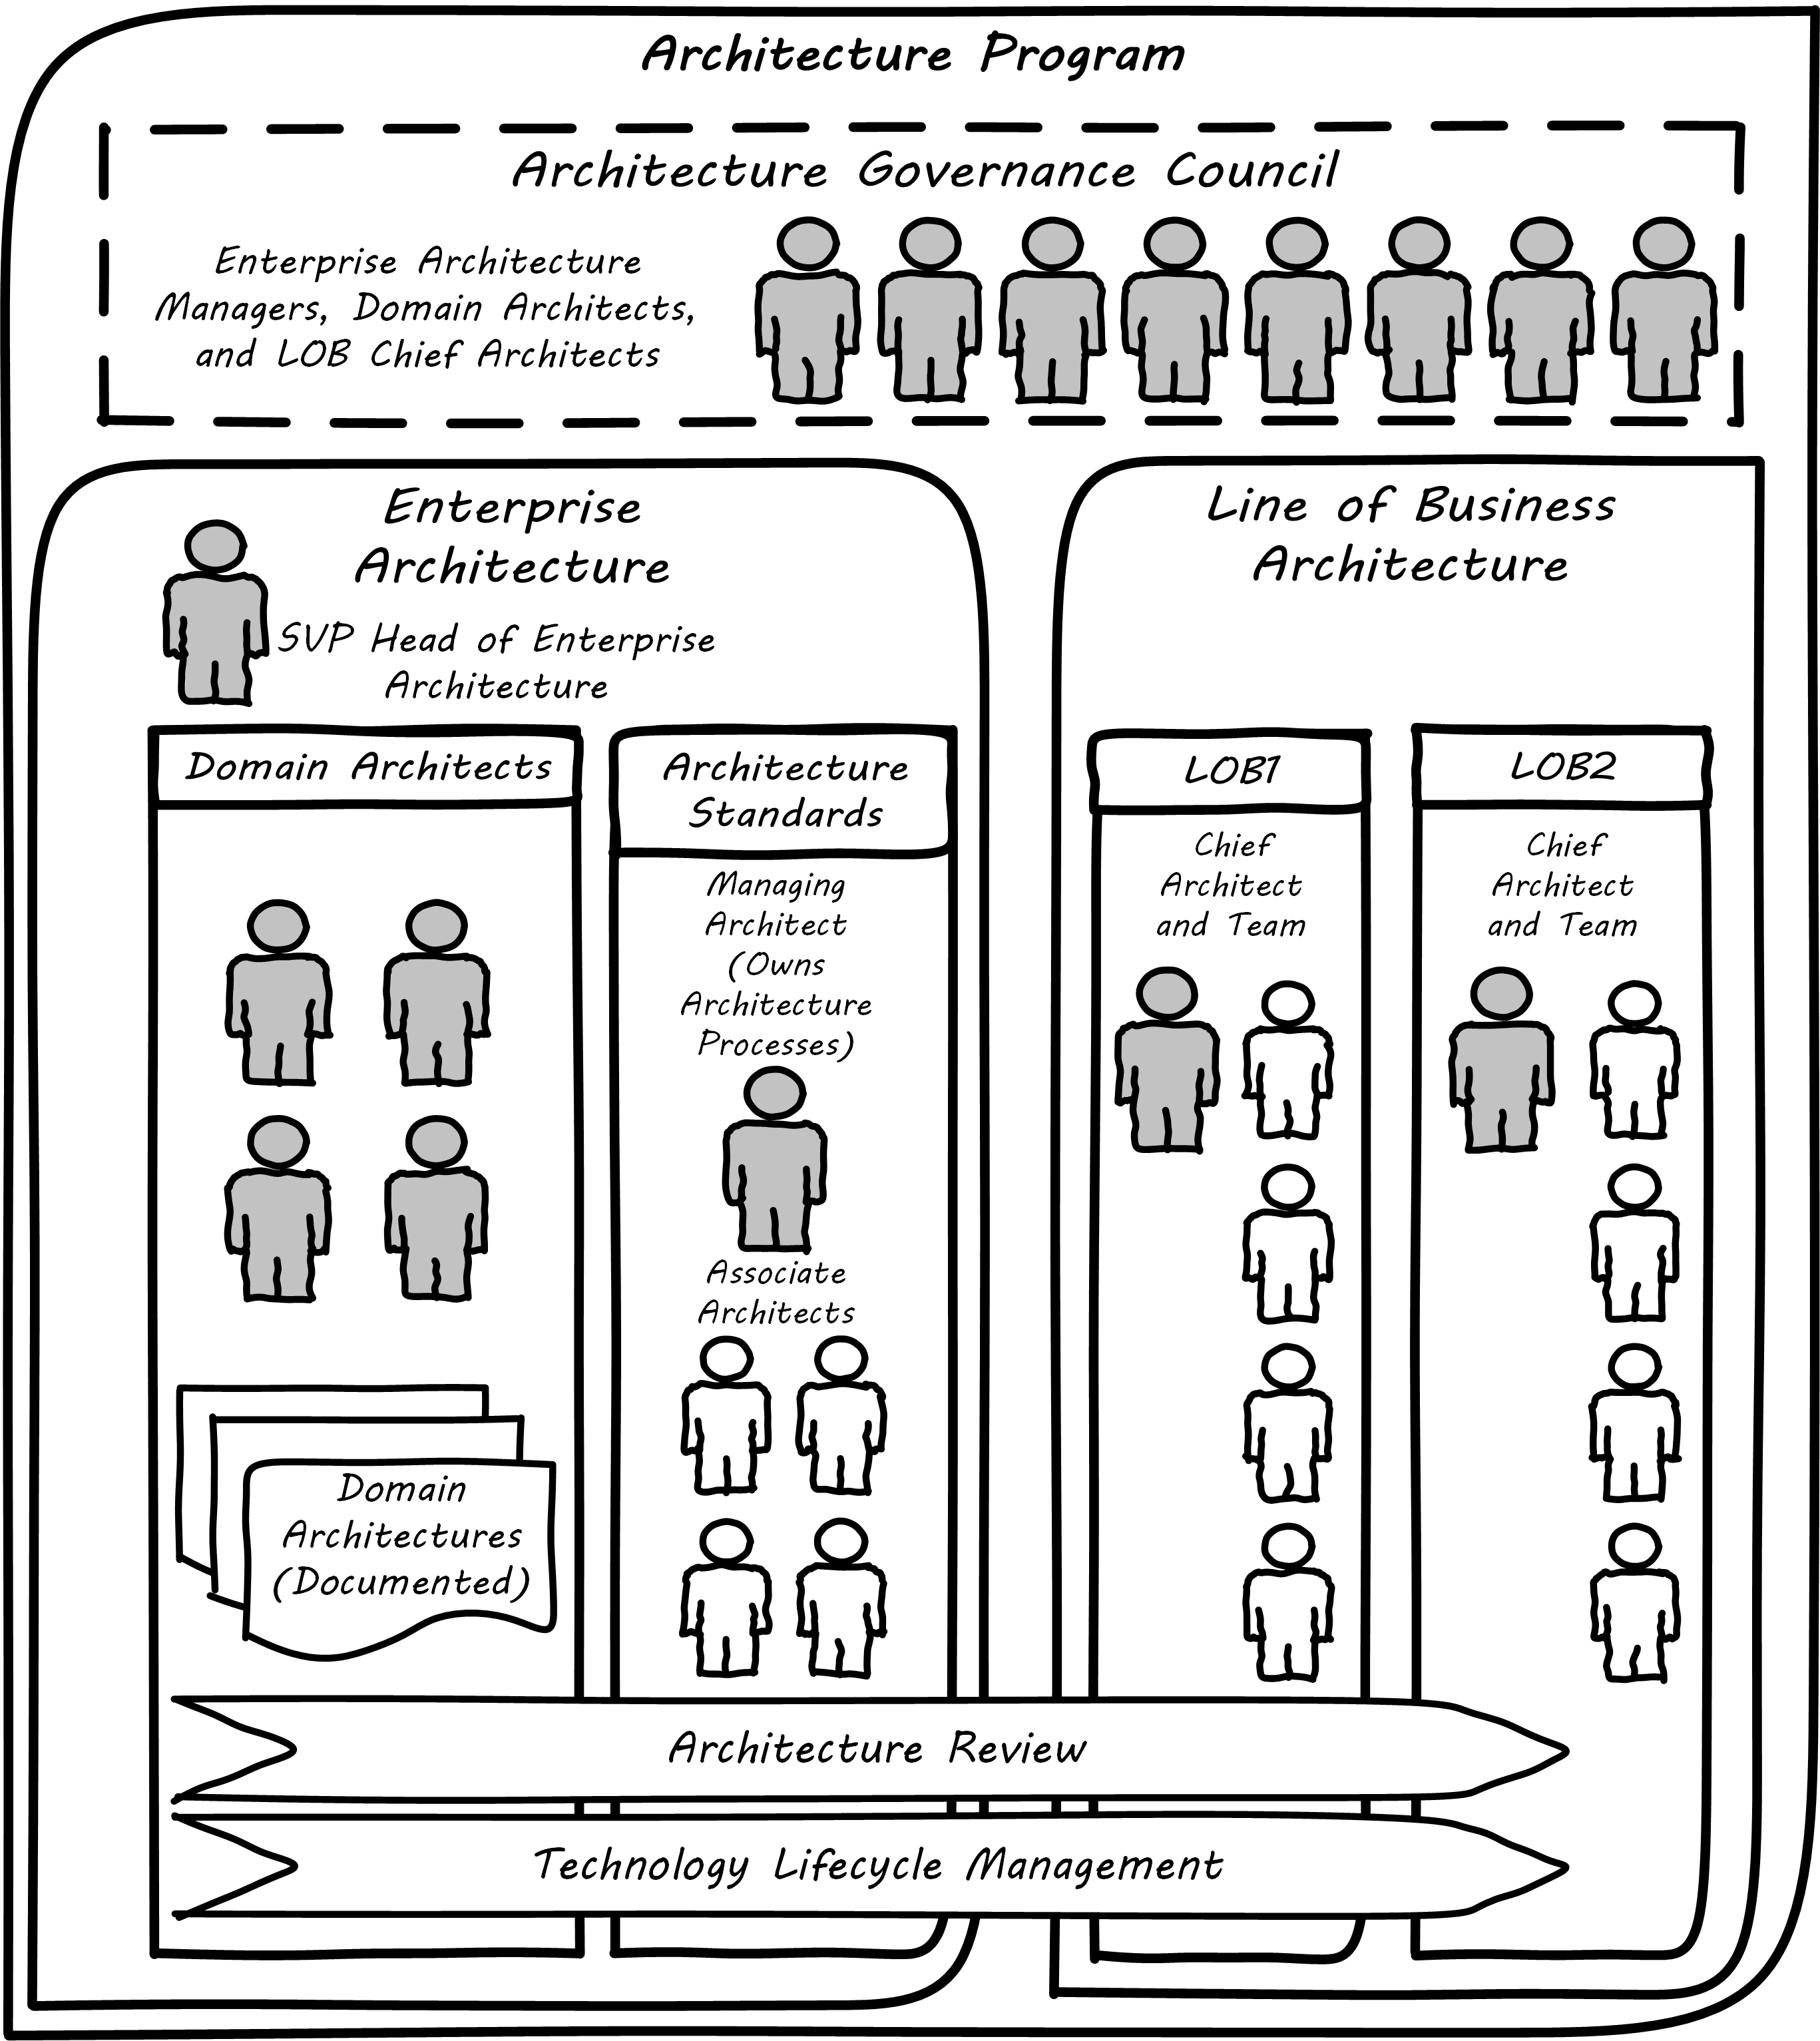
intended to serve a key coordination role. Illustrated in Large-Scale Architecture Program is a large-scale, coordinated architecture program in a large enterprise. Notice that this is not a single organization. The architecture program in this example spans a centralized Enterprise Architecture group as well as teams of Line of Business (LOB) architects.
The Enterprise Architecture organization might report to a Chief Technical Officer (CTO), the Chief of Staff for the Office of the CIO, or the head of Corporate Strategy and Planning. It is a centralized organization with a small staff of domain architects and an Architecture Standards organization that owns two key cross-functional architecture processes.
LOBs have dedicated IT organizations, and these organizations have Chief Architects with their own staff. In terms of our discussion of line/staff organization, it is as if the line organization has its own staff function within it; another way to think about it is that the line/staff division is fractal (that is, it reproduces at different scales).
Within the central Enterprise Architecture organization, we have a number of director-level Domain Architects. These architects might focus on particular business problems (e.g., Supply Chain) or architectural domains (e.g., Data and Information, or Security).
It is the responsibility of the Domain Architects to create Domain Architectures, which are documents that lay out an overall point of view on a particular domain and often serve as standards. These architectures may be created according to a methodology such as the TOGAF ADM, with the support of a repository-based tool and language such as ArchiMate notation or various standards from the Object Management Group.
The domain architects also serve as a senior consulting pool and are assigned to significant programs and projects as needed.
The Architecture Standards organization is responsible for two organization-wide architecture processes:
-
Architecture Review
-
Technology Lifecycle Management
The Architecture Review process is part of the investment process, when initiatives are initially scoped and direction set. The process requires architects to review significant proposed investments in new systems for consistency with standards (e.g., the Domain Architectures and approved technologies). In terms of the previous section’s impact model, this process is attempting to support many of the lines of value through controlling redundancy and ensuring reuse and application of previously learned architectural lessons.
The Technology Lifecycle Management process is the means by which new vendor and open source products are approved as fit-for-purpose and/or preferred within the organization. In terms of the previous section’s impact model, this process is tasked with reducing the portfolio of vendor products which reduces cost and risk as shown.
Both of these processes are enterprise-wide processes. They are owned, defined, and modified by the Architecture Standards organization, but projects and products across the enterprise follow these processes.
Finally, the Architectural Governance Council brings together the senior architects from the central Enterprise Architecture organization and the LOB Chief Architects. It is a virtual organization operating on a quarterly cadence, responsible for setting direction and resolving the most difficult questions that may emerge from the architecture processes and domain architectures.
Overall, this may seem like a complex structure, but similar structures are in place in IT organizations with budgets of $1bn or more. It would be questionable to see comparable structures in much smaller organizations. However, this structure is useful to examine; organizations of various sizes might choose to use different parts of it.
Modeling and Visualization
We discussed the importance of visual management in Work Management. Making information visually available to help create common ground is an important Lean practice; see Andon.
The word “architect”, whether in a building or digital context, is often associated with visualizations: blueprints, sketches, specialized notations, and so forth. Drawings have been used to represent structures for likely as long as writing has existed.
Judging simply by its history, visualization is, therefore, an essential tool for humans dealing with large-scale complexity (and erecting buildings has always been one of the more complex domains of human activity). In digital and IT contexts, however, visualization has certain challenges and notable skeptics. Adrian Cockcroft, the former CTO of Netflix, stated: “Our architecture was changing faster than you can draw it … As a result, it wasn’t useful to try to draw it.” [Bloomberg 2014]
Even in construction and engineering trades that rely on blueprints as a source of truth, keeping them up-to-date requires considerable discipline and process. In faster-moving digital organizations, visual models are almost always out-of-date unless they have been specifically refreshed for a purpose, or unless there is a strong formal process in place (and the value of such a process may be difficult to establish). That does not mean that diagrams will go away. Co-located teams use whiteboards and dry-erase markers and will continue to use them. There are important cognitive and human factor reasons for this that will not go away. Because of these facts, it is useful to understand some of the fundamentals of how humans interpret visual data.
Human Visual Processing
Dan Moody notes: “Visual representations are effective because they tap into the capabilities of the powerful and highly parallel human visual system. We like receiving information in a visual form and can process it very efficiently: around a quarter of our brains are devoted to vision, more than all our other senses combined. In addition, diagrams can convey information more concisely and precisely than ordinary language. Information represented visually is also more likely to be remembered due to the picture superiority effect … Visual representations are also processed differently: according to dual channel theory, the human mind has separate systems for processing pictorial and verbal material. Visual representations are processed in parallel by the visual system, while textual representations are processed serially by the auditory system …” [Moody 2009].
As the above quote shows, there are clear neurological reasons for diagramming as a communication form. To expand a bit more on the points Dan Moody is making:
-
Human vision uses parallel processing
This means that a given image or visual stimulus is processed by many neurons simultaneously. This is how we can quickly recognize and act on threats, such as a crouching tiger.
-
A large percentage of our brain is devoted to visual processing
You will see figures quoted from 25% to 66% depending on whether they are “pure” visual tasks or vision-driven tasks involving other brain areas.
-
The old saying “a picture is worth a thousand words” is consistent with the science
Diagrams can be both faster and more precise at conveying information; however, this has limits.
-
Pictures can be more memorable than words
Visualization in Digital Systems
Architects and architecture are known for creating diagrams – abstract graphical representations of complex systems. The first known instance of applying graphical techniques to a digital problem was in 1947 (see The First Software Flowchart,[1] Goldstine & von Neumann 1947), and visual notations have evolved along with the field of computing ever since. Notable examples include:
-
Early flowcharting templates
-
The Gane-Sarson data-flow diagram notation
-
The Chen entity-relationship notation
-
The Barker entity-relationship notation, including the “crow’s foot” to indicate cardinality
-
Harel state charts
-
The Unified Modeling Language® (UML®)
(We touched on data modeling in Information Management.) We will examine the ArchiMate® Model Exchange File Format for the ArchiMate Modeling Language, Version 3.0, a standard of The Open Group [C174], for a current and widely-used notation, in more detail in a future Competency Category.
Research at Microsoft suggests that developers use diagrams for four purposes:
-
Sharing
-
Grounding (defining ambiguous interpretations)
-
Manipulating
-
Brainstorming
They argue “diagrams support communicating, capturing attention, and grounding conversations. They reduce the cognitive burden of evaluating a design or considering new ideas” [Cherubini at al. 2007].
But visual notations have been problematic in the Agile community [Fowler 2004]. There is no question that some IT professionals, including perhaps some of the most skilled software engineers, find little of use in diagrams. As Martin Fowler says: “people like Kent (Kent Beck, eXtreme Programming originator) aren’t at all comfortable with diagrams. Indeed, I’ve never seen Kent voluntarily draw a software diagram in any fixed notation”. However, it seems likely that Kent Beck and others like him are members of a programming elite, with a well-honed mental ability to process source code in its “raw” form.
However, if we are building systems to be operated and maintained by humans, it would seem that we should support the cognitive and perceptual strengths of humans. Because diagrams are more readily processed, they are often used to represent high-level system interactions – how a given service, product, or application is related to peer systems and services. Building such depictions can be helpful to fostering a shared mental model of the overall system objectives and context. The more complex and highly-scaled the environment, the more likely such artifacts will be encountered as a means to creating the mental model.
The strength of human visual processing is why we will (probably) always use graphical representation to assist in the building of shared mental models. Specialists in the syntax and semantics of such designs will therefore likely continue to play a role in complex systems development and maintenance. Currently, if we seek to hire such a specialist, we recruit some kind of architect – that is, the professional role with the skills.
Note that flowcharts, data models, and other such diagrams tend to be associated more with the idea of “solutions” or “software” architecture. We will cover the architecture domains in the next Competency Category, including examples of Business Architecture diagrams.
Limitations of Visualization
Visualization has a number of limitations:
-
It may be better suited for static structures than for dynamic processes
-
Diagrams may have no real information content
-
Diagrams are difficult to maintain, and there are diminishing returns the more they are elaborated and refined (e.g., for archival purposes)
-
Conversely, diagrams become less accessible the more complex they are
-
Visualization can result in distorted understandings
-
Ultimately, diagrams rely on deeper shared understandings that must be understood and managed
Despite the familiarity of simple flowcharting, visual notations do not scale well in terms of representing program logic. Therefore, for dynamic or procedural problems, they tend to be used informally, as sketch or whiteboarding, or at the business analysis level (where the flowchart represents business logic, not detailed software). Dynamic processes also change more often than the static structures, and so must be updated more frequently.
More static structures, including data and class models and systems interactions, are still often represented visually and in the case of data models can be transformed from conceptual representations to physical schema.
However, any diagram, whether of a dynamic or static problem, can reach a level of density where it is no longer useful as a visual explanation. As diagrams become more complex, their audience narrows to those most familiar with them. Past a certain point, they exceed the limits of human visual processing and then are of little use to anyone.
This brings up broader concerns of the limits of human cognition; recent research shows that it is difficult for humans to hold more than four things in working memory – this is lower than previous estimates [Moskowitz 2008]. Diagrams with more than four to seven elements risk being dismissed as unusable.
Another issue with some diagrams is that they do not give a good sense of perspective or scale. This is sometimes seen in the Business Architecture practice of “capability mapping”. For example, suppose you see a diagram such as Simple Capability Map.
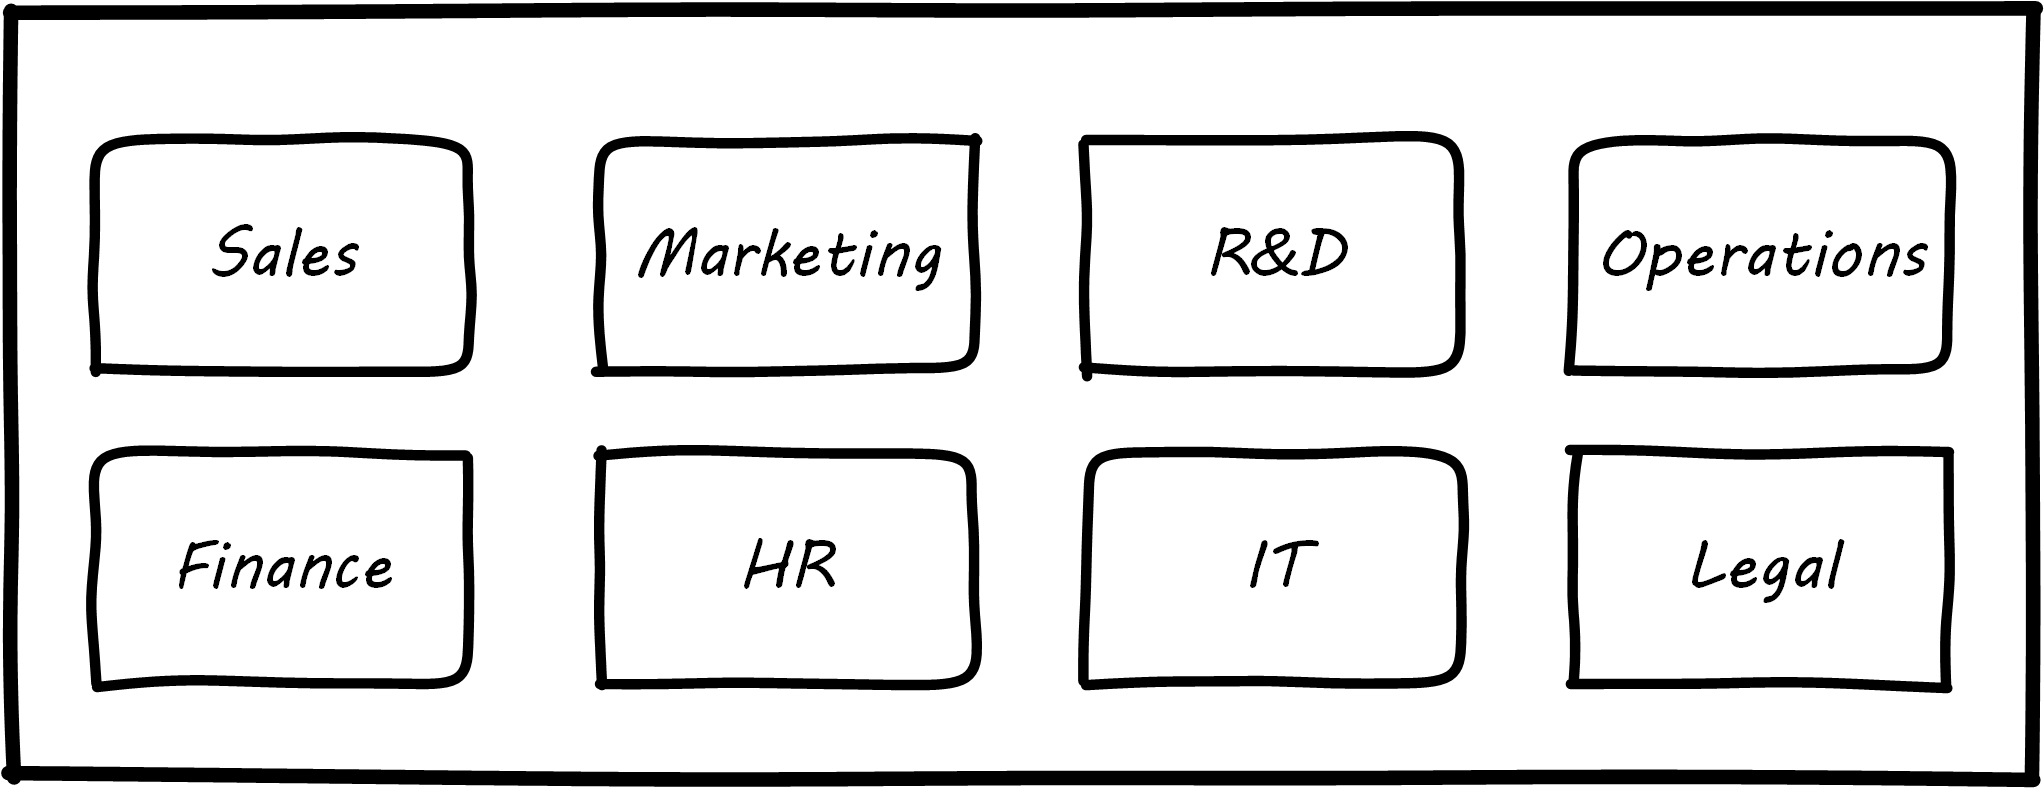
Diagrams like this are common, but what does it mean that all the boxes are equally sized? Are there as many lawyers as sales people? Operations staff? It is not clear what the advantage is to putting information like this into a graphical form; no interactions are seen, and the eight areas could more easily be expressed as a list (or “catalog” in the terms we will introduce below). This brings us to the final problem listed above: visualizations rely on some common ground understanding. If boxes and lines are used for communication, their meaning should be agreed – otherwise, there is a risk of misunderstanding, and the diagram may do more harm than good.
Regardless of the pitfalls, many architecture diagrams are valuable. Whether drawn on a whiteboard, in PowerPoint® or Omnigraffle™, or in a repository-based architecture tool, the visualization concisely represents a shared mental model on how the organizations will undertake complex activities. The diagram leverages the human preference for visual processing, accessing the powerful parallel processing of the visual cortex. Ultimately, the discussions and negotiations the architect facilitates on the journey to driving organizational direction are the real added value. The architect’s role is to facilitate discussions by abstracting and powerfully visualizing so that decisions are illuminated and understood across the team, or broader organization.
Repositories and Knowledge Management
Artifacts are generally classified as catalogs (lists of things), matrices (showing relationships between things), and diagrams (pictures of things). [C220]
The question was asked above: “Why put things into a picture when a report is all that is needed?”. We know that sometimes a picture is worth a thousand words, but not always. And sometimes the picture’s components need more description than can conveniently fit on the actual diagram. This brings us to the topic of Enterprise Architecture as knowledge management. Knowledge management is a broad topic, with a scope far beyond this document. But in the context of a digital organization, architecture can serve as an important component of an overall knowledge management strategy. Without some common ground of understanding, digital organizations struggle, and Enterprise Architecture can help.
Catalogs, Diagrams, Matrices
As the quote from the TOGAF Standard indicates, architecture can elegantly be represented as:
-
Catalogs
-
Diagrams
-
Matrices
For example, consider the image shown in Process and Function Diagram.
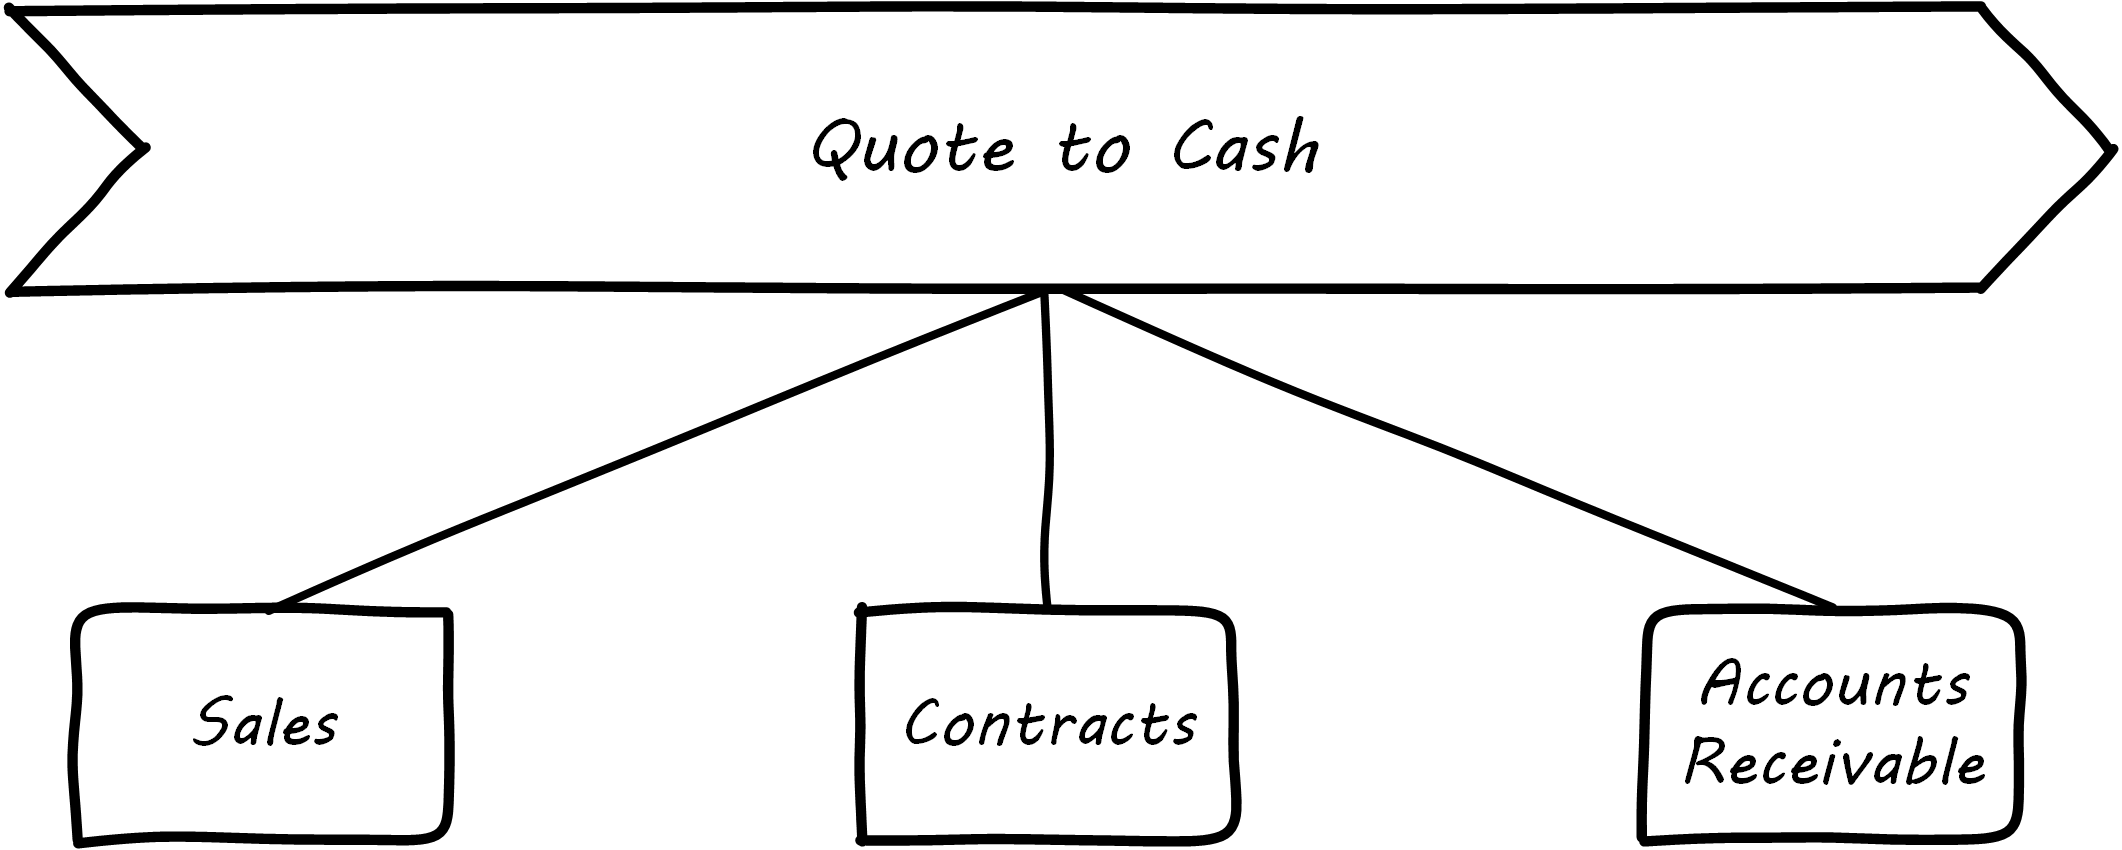
It can be read as saying that the “Quote to Cash” process depends on the following functions:
-
Sales
-
Contracts
-
Accounts Receivable
Notice that a matrix (see Process and Function Matrix) can be read in the same way.
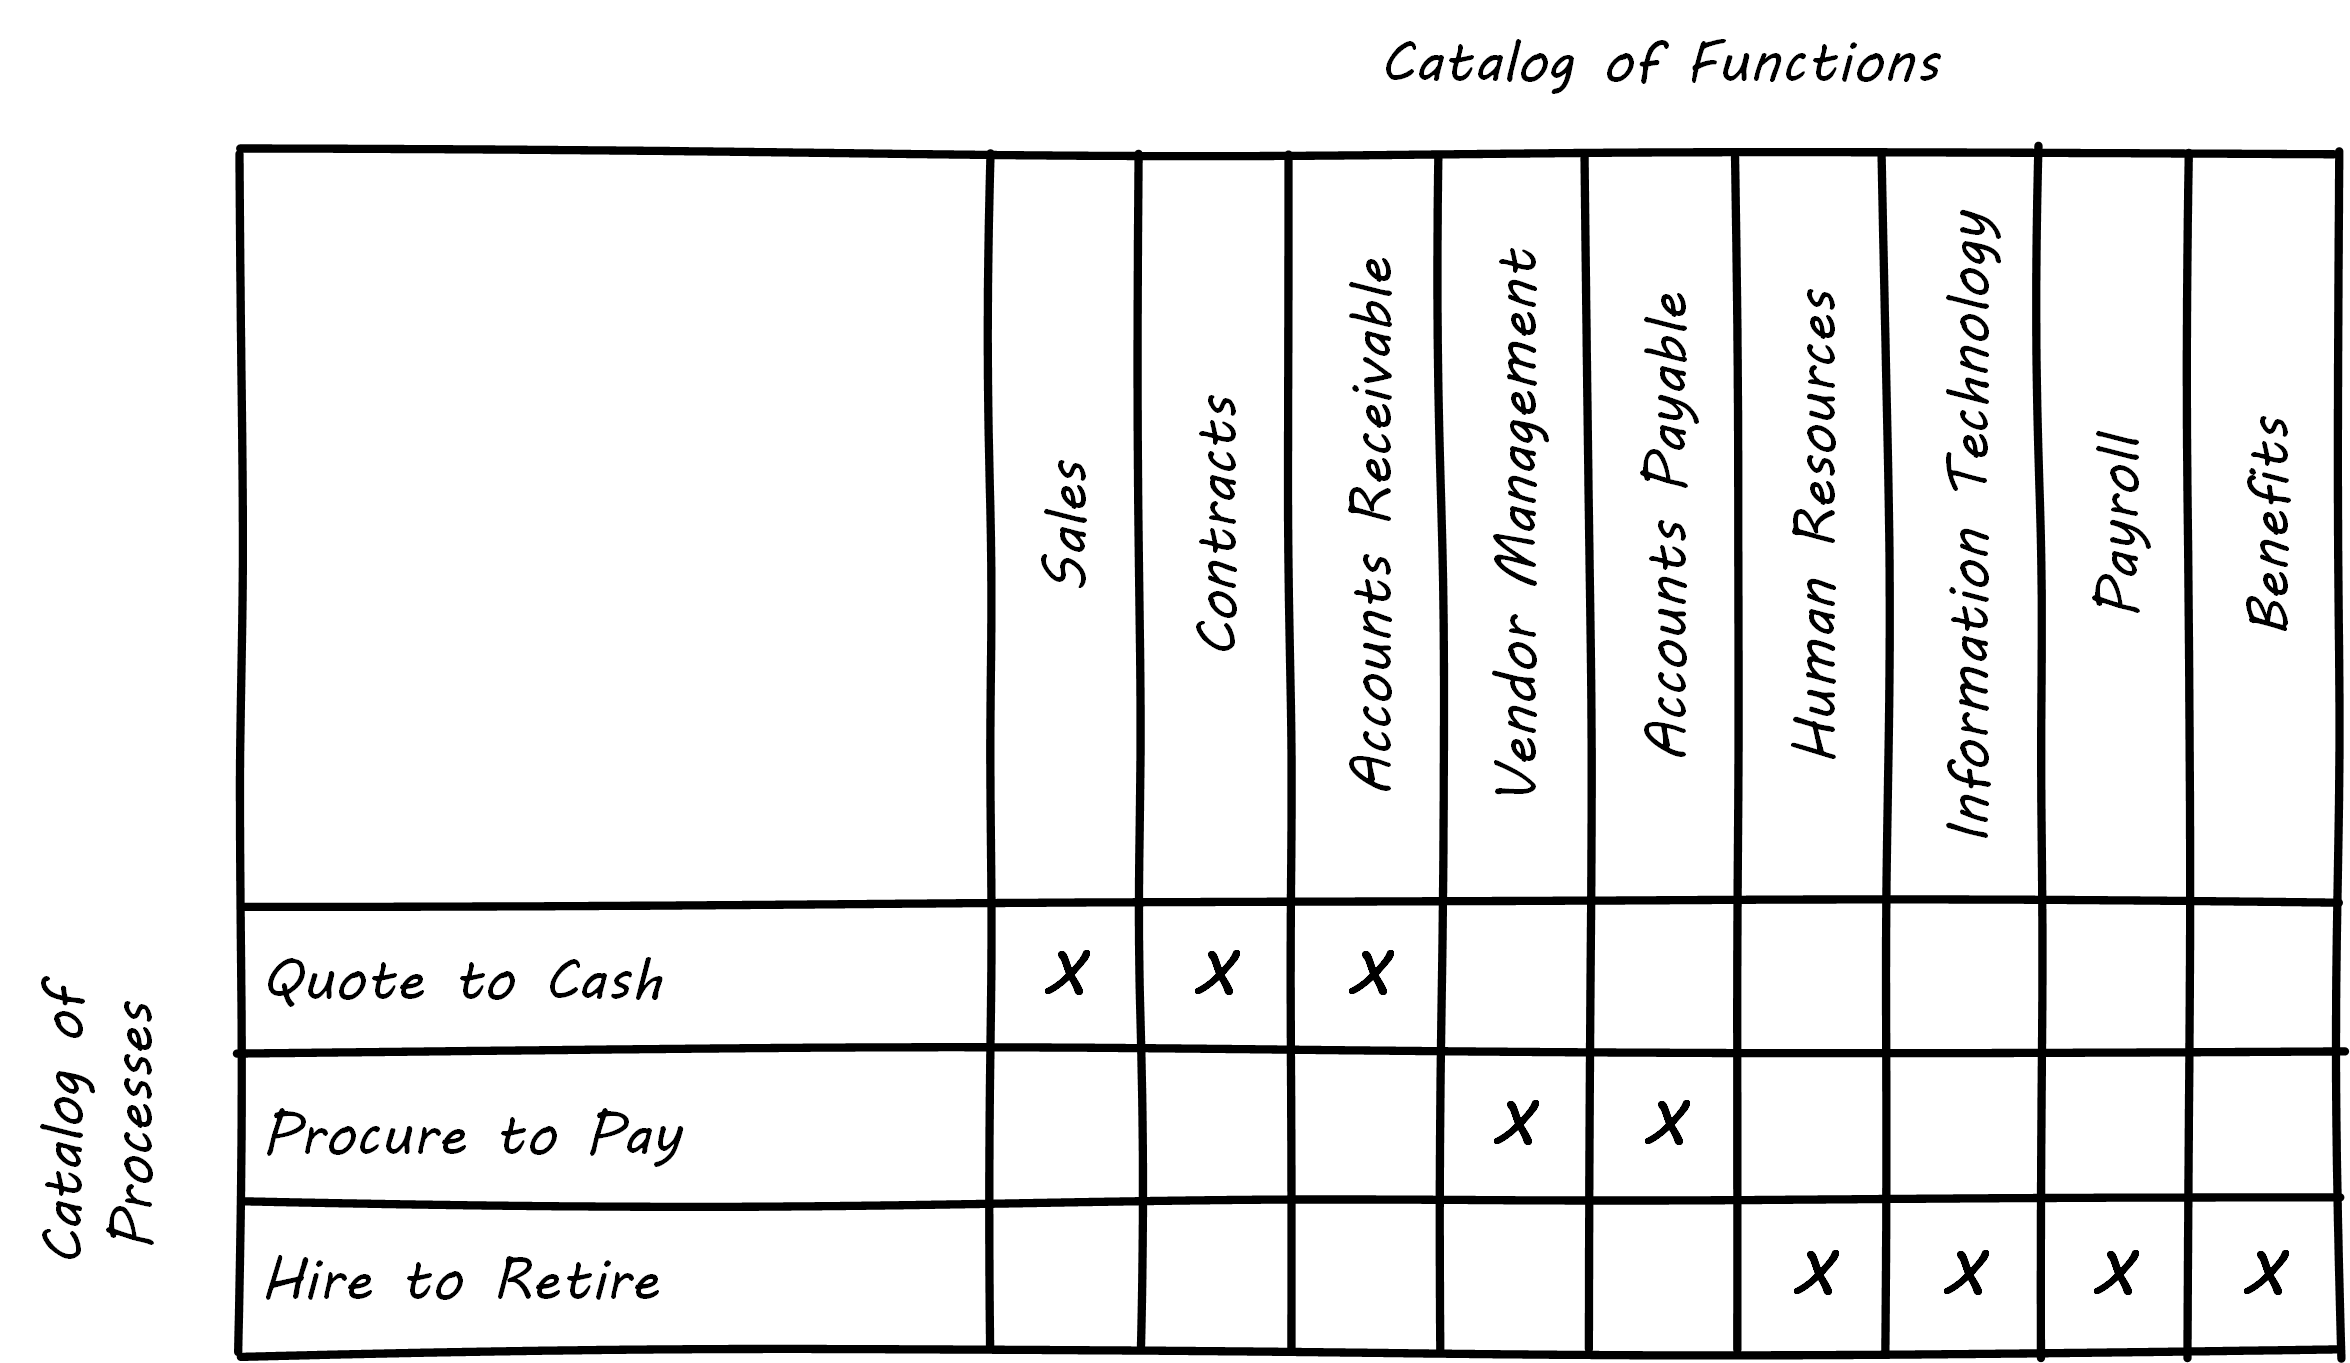
“Quote to Cash”, which appeared as a chevron in Process and Function Diagram, is now one of a list:
-
Quote to Cash
-
Procure to Pay
-
Hire to Retire
This list can be called a “catalog”. Similarly, there is another catalog of functions:
-
Sales
-
Contracts
-
Accounts Receivable
-
Vendor Management
-
Accounts Payable
-
Human Resources
-
IT
-
Payroll
-
Benefits
The functions appeared as rounded rectangles in Process and Function Diagram.
There are pros and cons to each approach. Notice that in about the same amount of space, the matrix also documented the dependencies for two other processes and six other functions. The matrix may also be easier to maintain; it requires a spreadsheet-like tool, where the diagram requires a drawing tool. But it takes more effort to understand the matrix.
Maintaining a catalog of the concepts in a diagram becomes more and more important as the diagram scales up. Over time, the IT operation develops significant data by which to manage itself. It may develop one or more definitive portfolio lists, typically applications, services, assets, and/or technology products. Distinguishing and baselining high-quality versions of these data sets can consume many resources, and yet managing the IT organization at scale is nearly impossible without them. In other words, there is a data quality issue. What if the boxes on the diagram are redundant? Or inaccurate? This may not matter as much with a tight-knit team working on their whiteboard, but if the diagram is circulated more broadly, the quality expectations are higher.
Furthermore, it is convenient to have data such as a master lists or catalogs of processes, systems, functions, or data topics. We might also want to document various attributes associated with these catalogs. This data can then be used for operational processes, such as risk management, as we have discussed previously. For these reasons and others, Enterprise Architecture repositories emerge.
Architecture Data Management
When we establish a catalog of architectural entities, we are engaging in master data management. In fact, the architectural concepts can be represented as a form of database schema; see A Simple Metamodel.
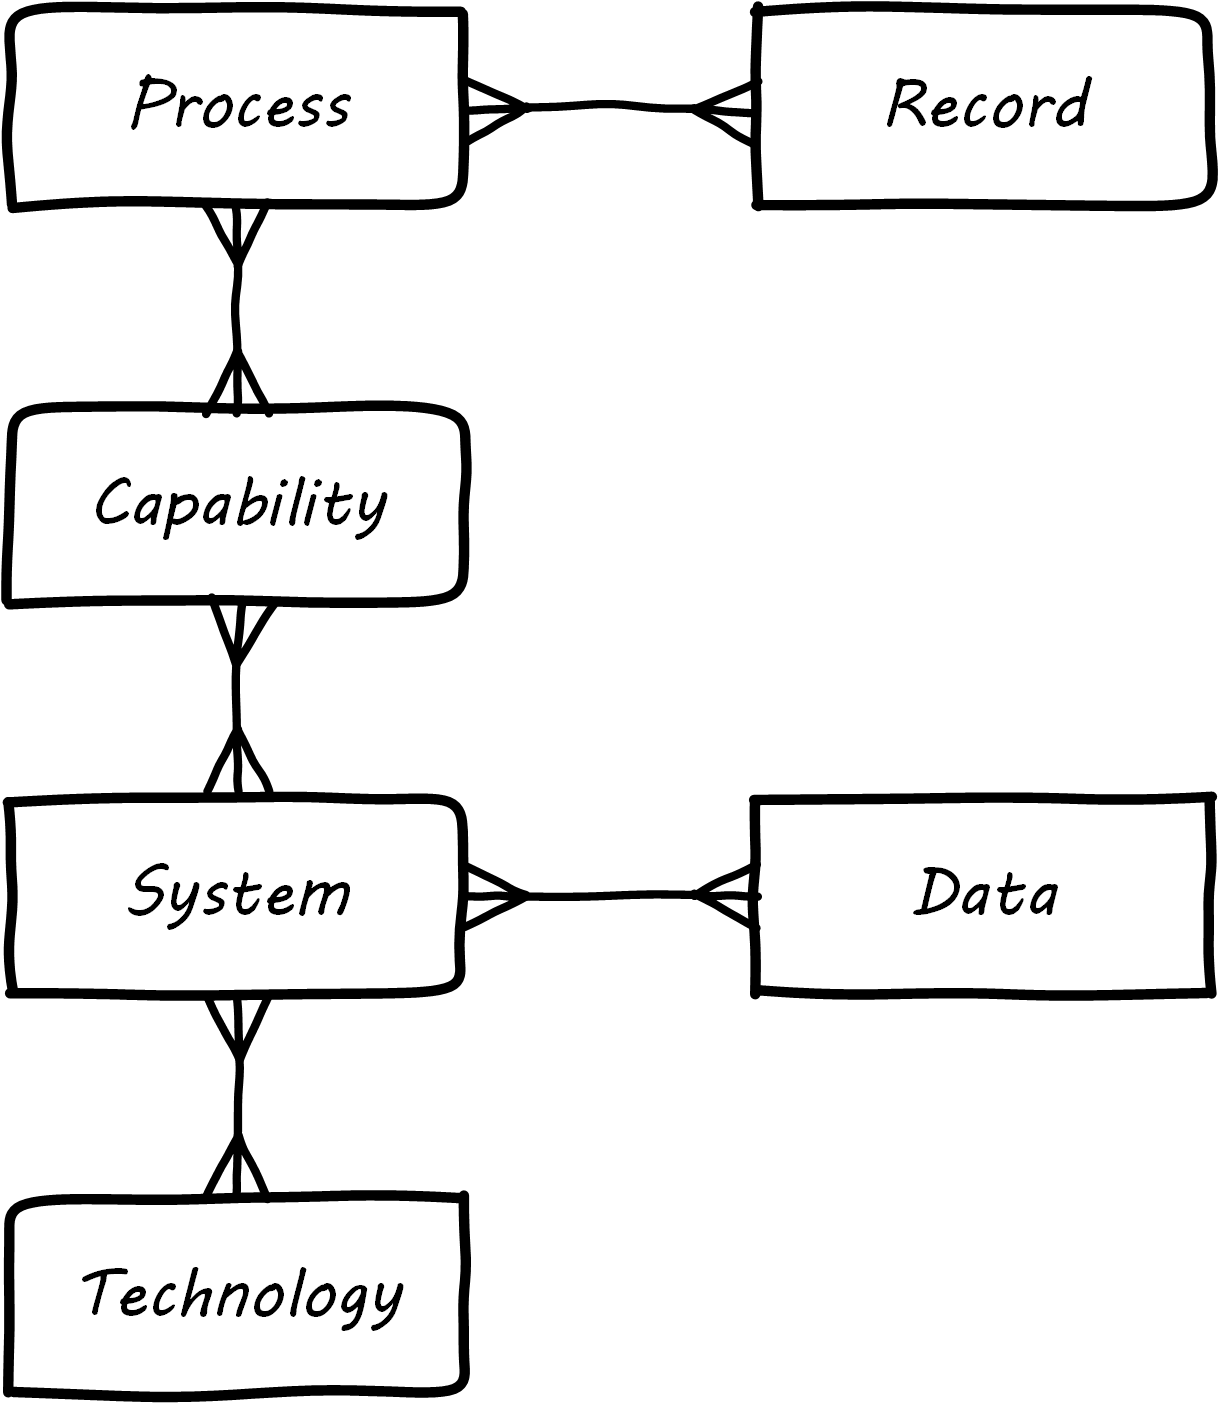
| A data model that organizes data about data and its related systems can be called a metamodel. |
Material that we first saw in diagram form can be stored in a database. Systems that enable this are called Enterprise Architecture repositories. Their data schemas are often called metamodels.
Architecture repositories require careful management. A common anti-pattern is to acquire them without considering how the data will be maintained. The concepts in the repository can be subjective, and if it is intended that they be of high data quality, investments must be made. Some kind of registration process or decision authority must exist for the creation of, for example, a new, official “system” record. Misunderstandings and disagreements exist about the very meaning of terms like “system” or “technology”. (We discussed some of the general issues in Information Management, with the ontology problem.) Such issues are especially difficult when Enterprise Architecture repositories and metamodels are involved. Frequent topics include:
-
Is an “application” different from a “service”, and if so, how?
-
What is the relationship between a “capability” and a “function”, or a “capability” and a “process”?
-
How can we distinguish between “systems” and “technologies”?
-
What is the relationship between a “product” and a “service”, especially if the service is a market-facing digital one?
-
What are the relationships between:
-
Value chain
-
Value stream
-
Process
-
Activity
-
Task
-
We might expect that there would be industry standards clarifying such issues, and in some cases there are. In other cases, either there are no standards, or the standards are obsolete or conflicting.
Finally, there are a number of other systems that may interoperate with the architecture repository. The most important of these is the CMDB or CMS that underlies the ITSM tooling. These tools also need to know at least about systems and technologies and may be interested in higher-level concepts such as business capability. However, they usually do not include sophisticated diagramming capabilities or the ability to represent a system’s future state.
Other tools may include project management systems, portfolio management systems, risk management systems, service-level management systems, and others. Application and service master data, in particular, is widely used, and if the Enterprise Architecture repository is a System of Record for this data there will be many outbound interfaces.
An Economic View
| The discussion below also applies to the CMDB as well as other similar repositories. |
Part of the challenge of any repository is what data to manage. How do we think more systematically about this? First, we need to understand why we want to assemble this data in a ready-to-query repository. There are two major reasons why we store data:
-
There are no other sources for it – if we do not establish a System of Record, the data will go unmanaged, and we will not know what servers we have, or what applications we are running
-
There may be other sources for the data, even System of Record, but we need an operational data store to bring the various data sources together in a way that makes them more efficient to query
For either kind of data, you need to have an economic understanding of why you want it. Suppose you need to find out what applications you are running because you want to rationalize them. You could invest weeks of research into the question, costing perhaps tens of thousands of dollars worth of yours and others’ time, to create a one-time spreadsheet.
But what happens when there are multiple purposes for the data? You find out that the security group also wants a master list of applications and has been compiling a different spreadsheet, for example. What happens when the same engineers and managers are asked for the same data over and over again because there is no repository to maintain this organizational memory?
The challenge is, when does it make economic sense to pre-aggregate the data? The economic graph shown in Economic Value of the Enterprise Architecture Repository may assist in thinking about this.
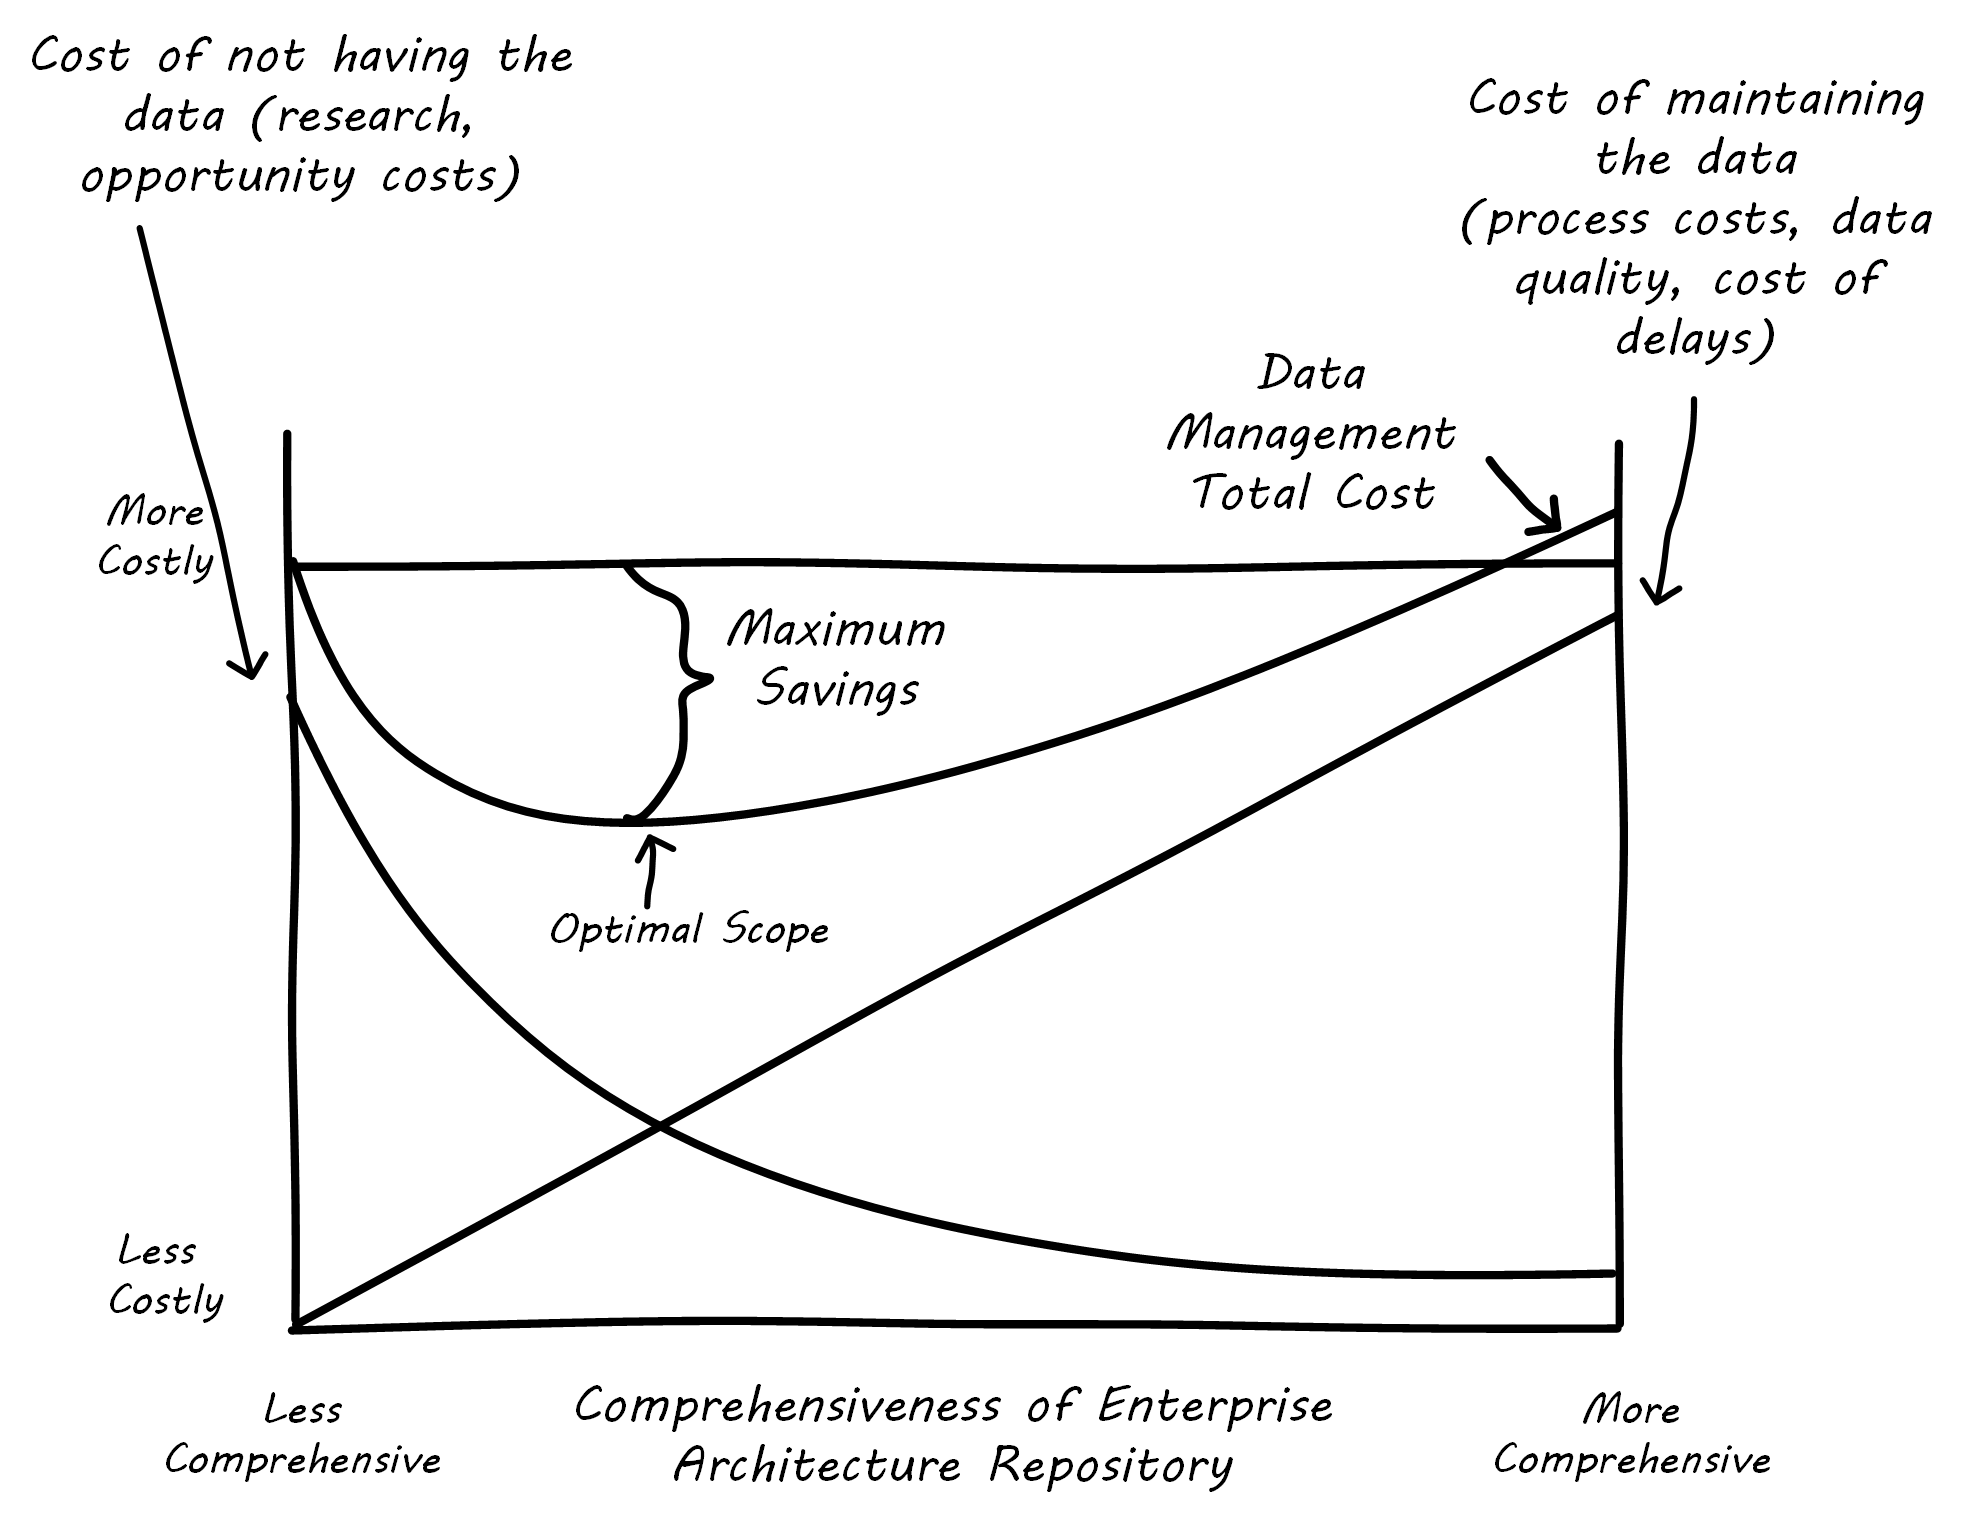
The graph may be familiar to those of you who studied economics. On the left, you have the assumption of no architecture repository, and on the right, you have a comprehensive architecture repository. With a less comprehensive architecture repository, you are paying some cost in research and outage impacts. You also are incurring more risk, which can be quantified. On the other hand, with a comprehensive architecture repository, you incur more costs in maintaining it. You need processes that have a direct cost to operate, as well as imposing indirect costs such as the cost of delay (e.g., if updating the architecture repository slows down the release schedule).
But in the middle is a sweet spot, where you have “just enough” architecture repository data. This optimal architecture repository scope represents the real savings you might realize from instituting the architecture repository and the necessary processes to sustain it.
This is not a complete business case, of course. Your projected savings must be offset against the costs of acquisition and operations, and the remaining “benefit” needs to exceed your organization’s hurdle rate for investments.
The IT Lifecycles
We have discussed products and the various ways digital organizations deliver them, from simple work management to more sophisticated project and process management approaches. Now, we need to refine our understanding of the products themselves and how they are managed.
We previously discussed the relationship between feature versus component teams in Competency Area 4. In Competency Area 9, we touched on the idea of shared services teams. Both of these ideas are now expanded into what is called the "four lifecycle model”.
The four lifecycle model was first documented in Betz 2011a. The four lifecycles are:
-
The application service lifecycle
-
The infrastructure service lifecycle
-
The asset lifecycle
-
The technology product lifecycle
Each of these lifecycles reflects the existence of a significant concept, that is managed over time as a portfolio. (More on IT portfolio management practices in Competency Area 12.)
First, bear in mind that services are kinds of products. Digital value is usually delivered as a service, and shares standard service characteristics from an academic perspective, including the idea that services are produced and consumed simultaneously (e.g., an account lookup) and are perishable (a computer’s idle time cannot be recovered if it goes unused).
The first two concepts (application and infrastructure service) below reflect these characteristics; the second two (asset and technology product) do not.
An application service is a business or market-facing digital product, consumed by people whose primary activities are not defined by an interest in IT; for example, a bank customer looking up her account balance, or an Accounts Payable systems operator. In terms of “feature versus component”, the concept of application is more aligned to “feature”. An example would include an Online Banking system or a Payroll system.
The application service lifecycle is the end-to-end existence of such a system, from idea to retirement. In general, the realization such a system is needed originates externally to the IT capability (regardless of its degree of centralization). SaaS usage is also tracked here.
An infrastructure service is, by contrast, and as previously discussed, a digital or IT service primarily of interest to other digital or IT services/products. Its lifecycle is similar to that of the application service, except that the user is some other IT service. An example would be a storage area network system managed as a service or the integrated networking system required for connectivity in a data center. Product as a Service and IaaS are also tracked here.
Note that in terms of our service definition discussion, the above lifecycle concepts are service systems. The lifecycle of service offerings is a business lifecycle having more to do with the go-to-market strategy on the part of the firm. We covered this to some extent in Competency Area 4 and revisited it in Competency Area 12.
An asset is a valuable, tangible investment of organizational resources that is tracked against loss or misuse, and optimized for value over time. It can sit unused and still have some value. Examples would include a physical server or other device, or a commercial software license. Whether assets can be virtual is a subject of debate and specific to the organization’s management objectives. (Given the licensing implications of virtual servers, treating them as assets is not uncommon.)
The asset lifecycle is distinct from the service lifecycles, following a rough order including standard supply chain activities:
-
Forecast
-
Requisition
-
Request quote
-
Order
-
Deliver
-
Accept
-
Install/configure
-
Operate
-
Dispose
A contract reserving cloud capacity is also an asset.
Finally, a technology product is a class of assets, the “type” to the asset “instance”. For example, the enterprise might select the Oracle relational database as a standard Technology Product. It might then purchase ten licenses, which are assets.
The technology product lifecycle is also distinct from both the service and asset lifecycles:
-
Identify technical requirement or need
-
Evaluate options
-
Select product (may kick off asset lifecycle)
-
Specify acceptable use
-
Maintain vendor relationship
-
Maintain product (e.g., patching and version upgrades)
-
Continuously evaluate product’s fitness for purpose
-
Retire product from environment
Cloud services need to be managed in terms of their version and interoperability concerns.
The challenge in digital management is “lining up the lifecycles” so that transactional value flows across them; see Multiple Lifecycle Model, similar to Betz 2011a.
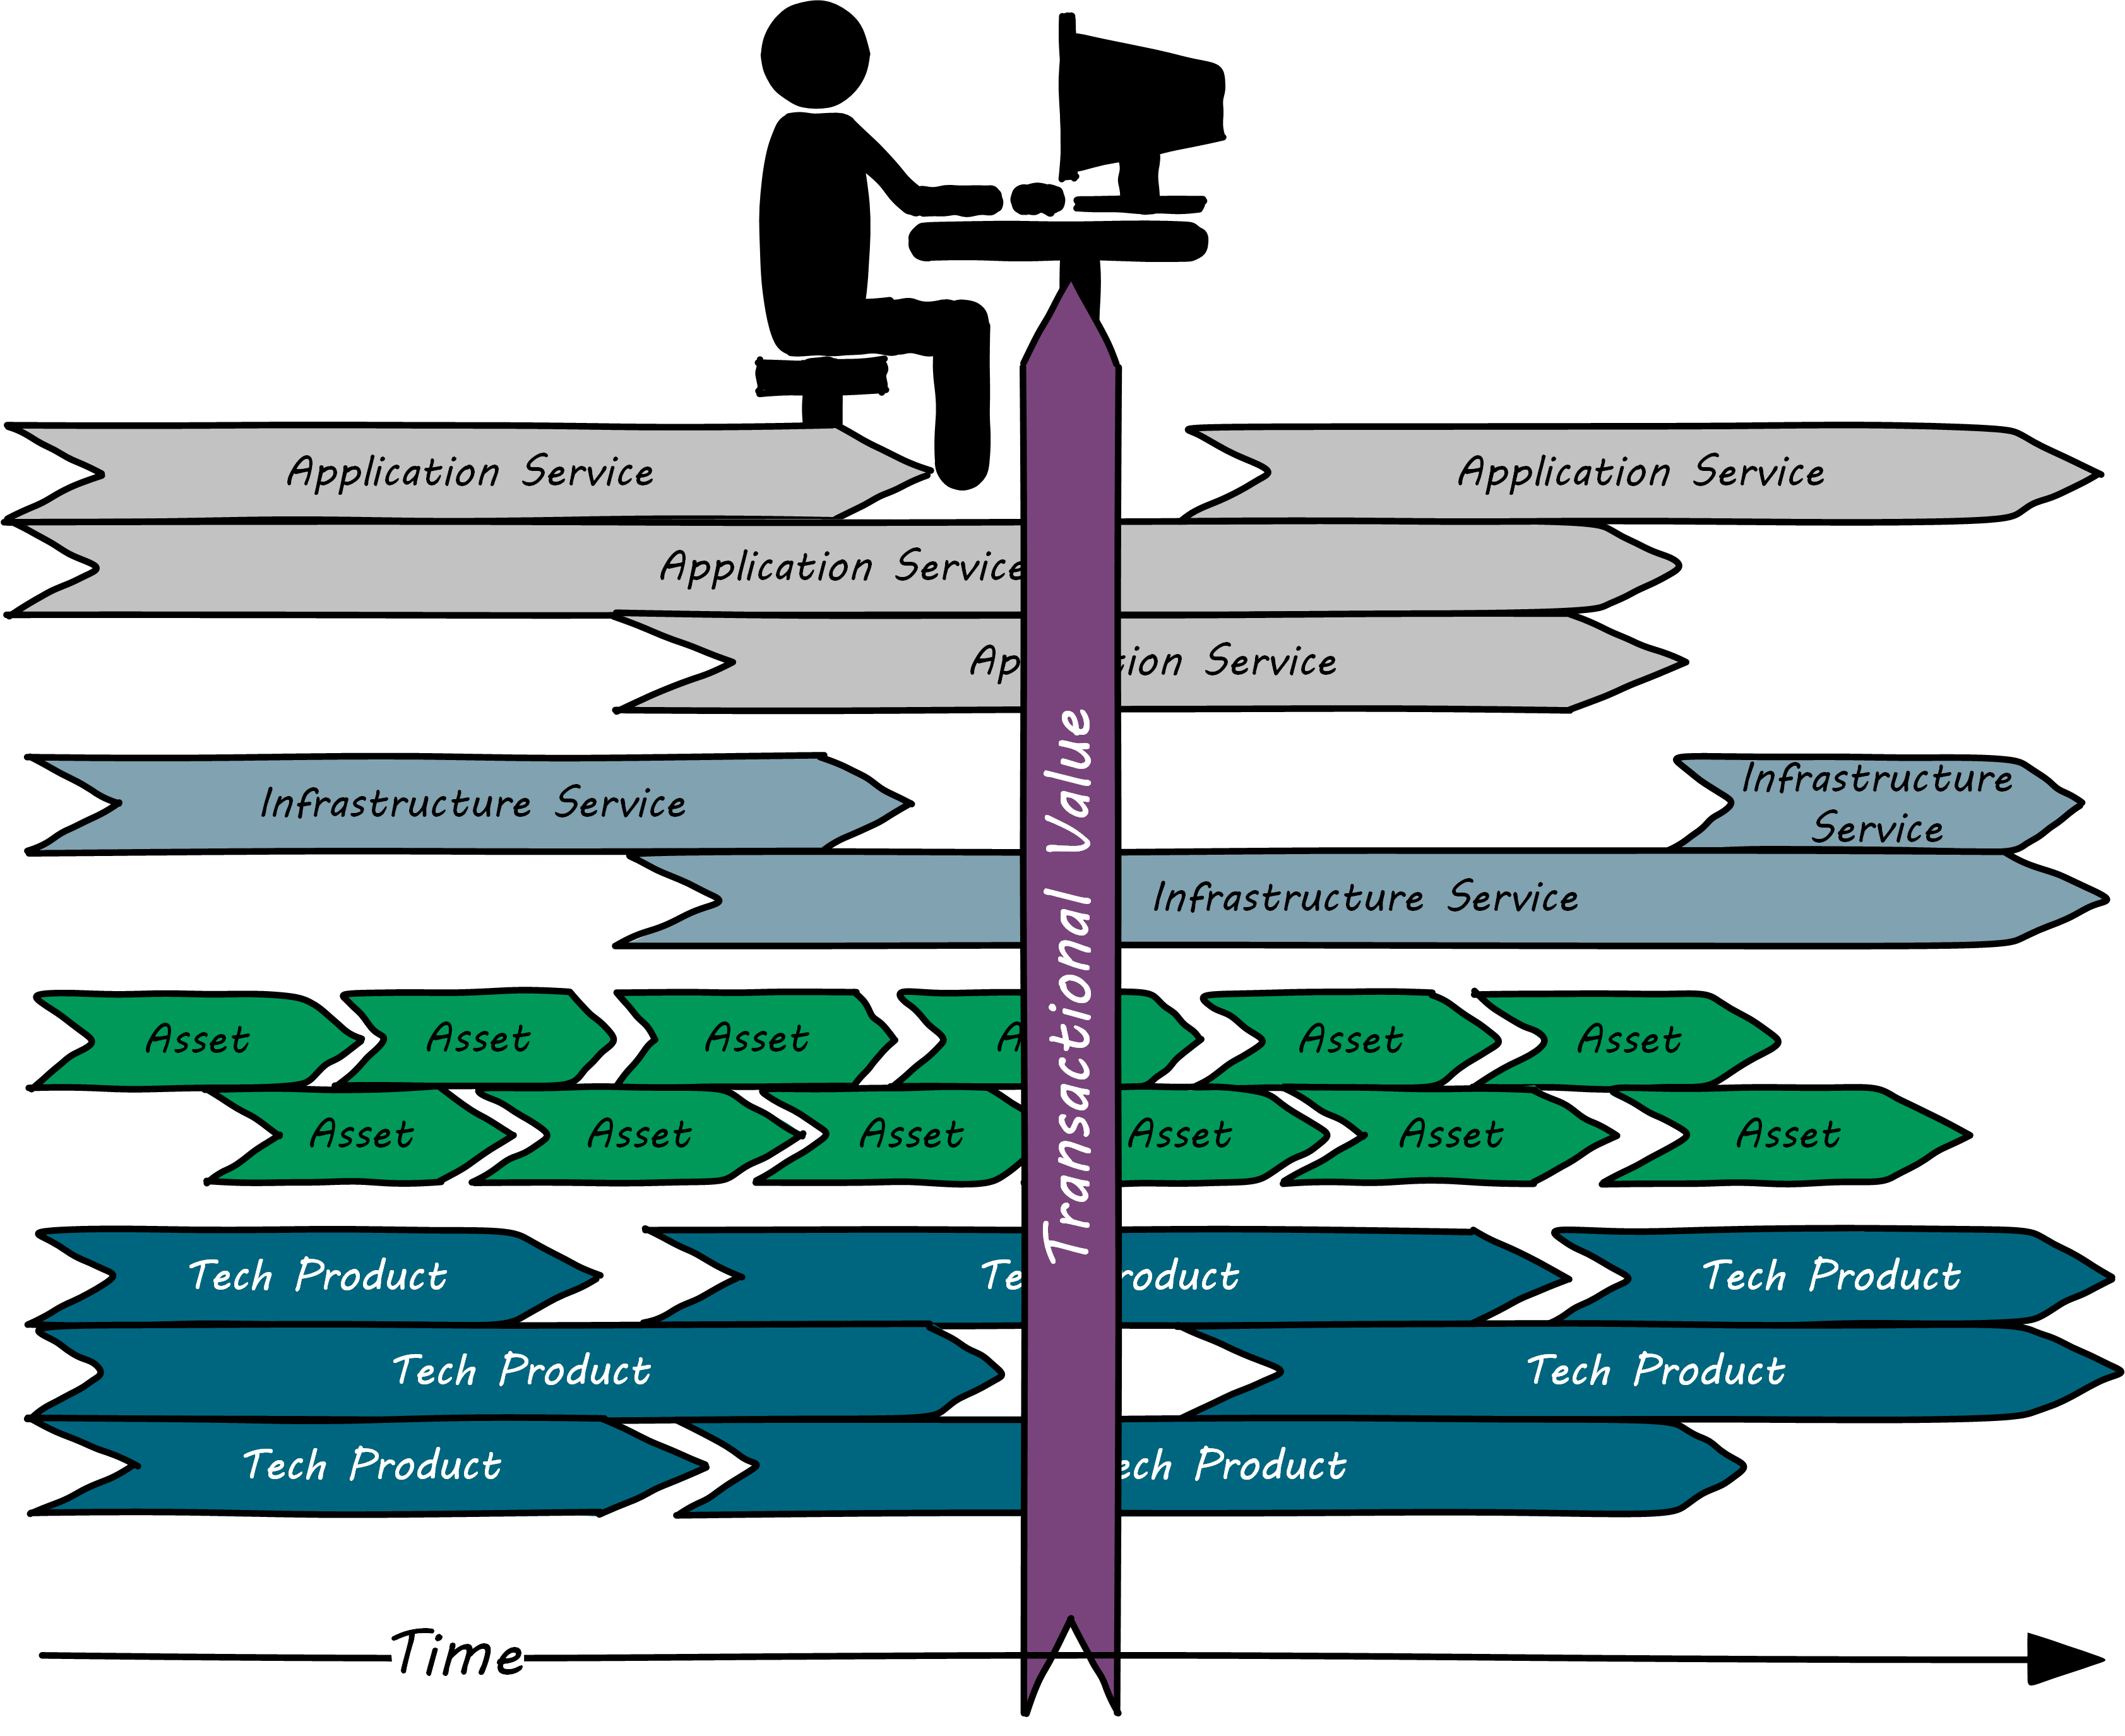
This can be very difficult, as each lifecycle has a logic of its own, and there may be multiple interdependencies. A technology product may come to the end of its market life and drive expensive changes up the stack. Conversely, new application requirements may expose deficiencies in the underlying stack, again requiring expensive remediation. Technology product vulnerabilities can prove disruptive, and the asset lifecycle (representing either physical depreciation and refresh cycles, or time-bound licensing) is a significant cost driver.
The “Rationalization” Quest
“Rationalization” is often listed as one of the major outcomes of Enterprise Architecture. What is meant by this? Let us return to our scenario of one company acquiring another. As the newly merged company takes stock of its combined assets, it becomes clear that decisions need to be made. Among other areas, redundant systems exist for:
-
Marketing
-
Human resources
-
Accounting
The digital pipelines also are inconsistent, one being based on GitHub and Travis CI, the other being based on local Git and Jenkins.
Decisions need to be made as to which systems will “go-forward”. While the teams involved will have strong input into the system decisions that affect them and will do most of the work, there is concern that some overall view and coordination of the effort is required. What if teams cannot come to a consensus? What if there is an opportunity to save money by standardizing on one vendor to support multiple diverse teams? For these reasons, the company assigns an architect to work closely with the overall merger program.
A merger is a dramatic example of a rationalization scenario. Established, ongoing companies, even without mergers, find that redundancy tends to accumulate. This is a normal outcome of the innovation and commoditization cycle; when technologies are new, organizations may experiment with several providers. When they become more standardized, and commoditized, the desire for efficiency drives rationalization.
One of the challenges for rationalization is whether the economics and business context of any given rationalization effort are well understood. Consistency as an end in itself is not necessarily valuable. The impacts on enterprise value must be established: will the organization actually benefit from improved vendor leverage, operational integration, or a reduced security attack surface? If not, perhaps seeking “rationalization” is not the best use of organizational resources.
Evidence of Notability
Architecture implies a set of practices that can be controversial. Its use as a management program, its use of repositories, and its emphasis on visualization are all notable aspects that are often debated as to their value.
Limitations
Architecture practices such as those discussed here are typically seen only in large organizations requiring institutional continuity.
Related Topics