Analytics
Description
Analytics in Context
One important aspect of digital product development is data analytics. Analysis of organizational records has always been a part of any concern large enough to have formal records management. The word for this originally was simply “reporting”. A set of files or ledgers would be provided to one or more clerks, who would manually review them and extract the needed figures.
We have touched on reporting previously, in our discussion of metrics. Here is a more detailed examination. The compilation of data from physical sources and its analysis for the purposes of organizational strategy was distinct from the day-to-day creation and use of the data. The clerk who attended to the customer and updated their account records had a different role than the clerk who added up the figures across dozens or hundreds of accounts for the annual corporate report.
What do we mean by the words “analysis” or “analytics” in this older context? Just compiling totals and averages was expensive and time-consuming. Cross-tabulating data (e.g., to understand sales by region) was even more so. As information became more and more automated, the field of “decision support” (and its academic partner “decision sciences”) emerged. The power of extensively computerized information that could support more and more ambitious forms of analysis gave rise to the concept and practice of “data warehousing” [Inmon 2005]. A robust profession and set of practices emerged around data warehousing and analytics. As infrastructure became more powerful and storage less expensive, the idea of full-lifecycle or closed-loop analytics originated.
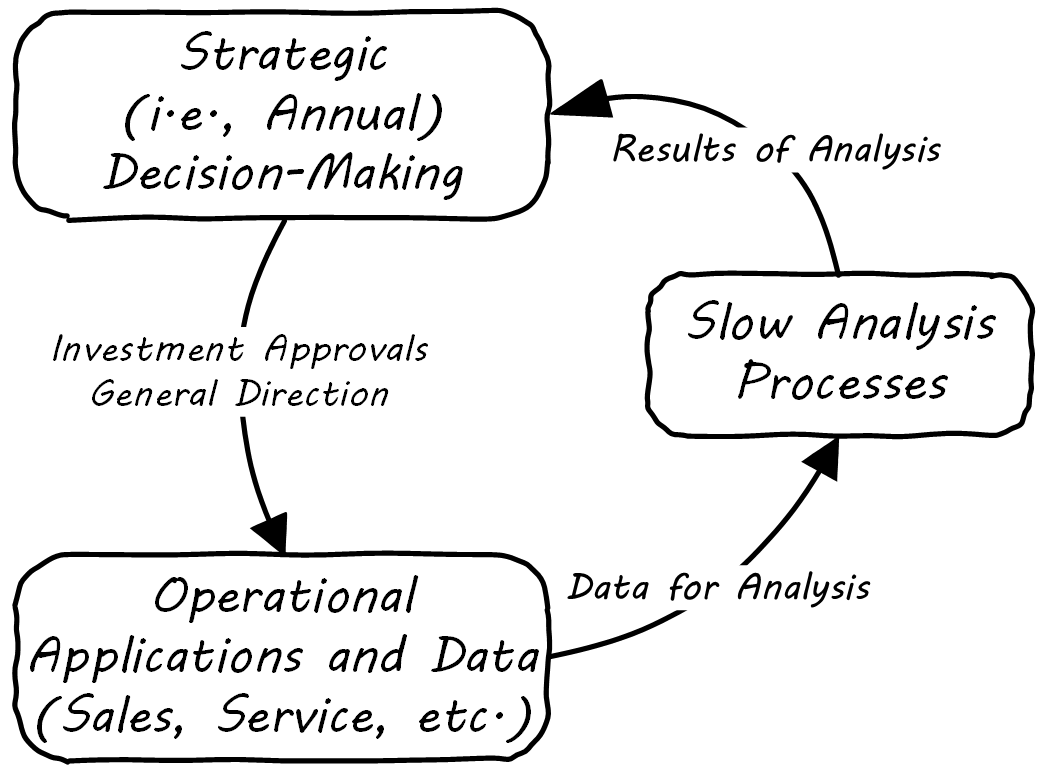
When analyzing data is costly and slow, the data analysis can only affect large, long-cycle decisions. It is not a form of fast feedback. The annual report may drive next year’s product portfolio investment decisions, but it cannot drive the day-to-day behavior of sales, marketing, and customer service; see Strategic Analytics.
However, as analysis becomes faster and faster, it can inform operational decisions; see Operational Analytics (Closed-Loop).
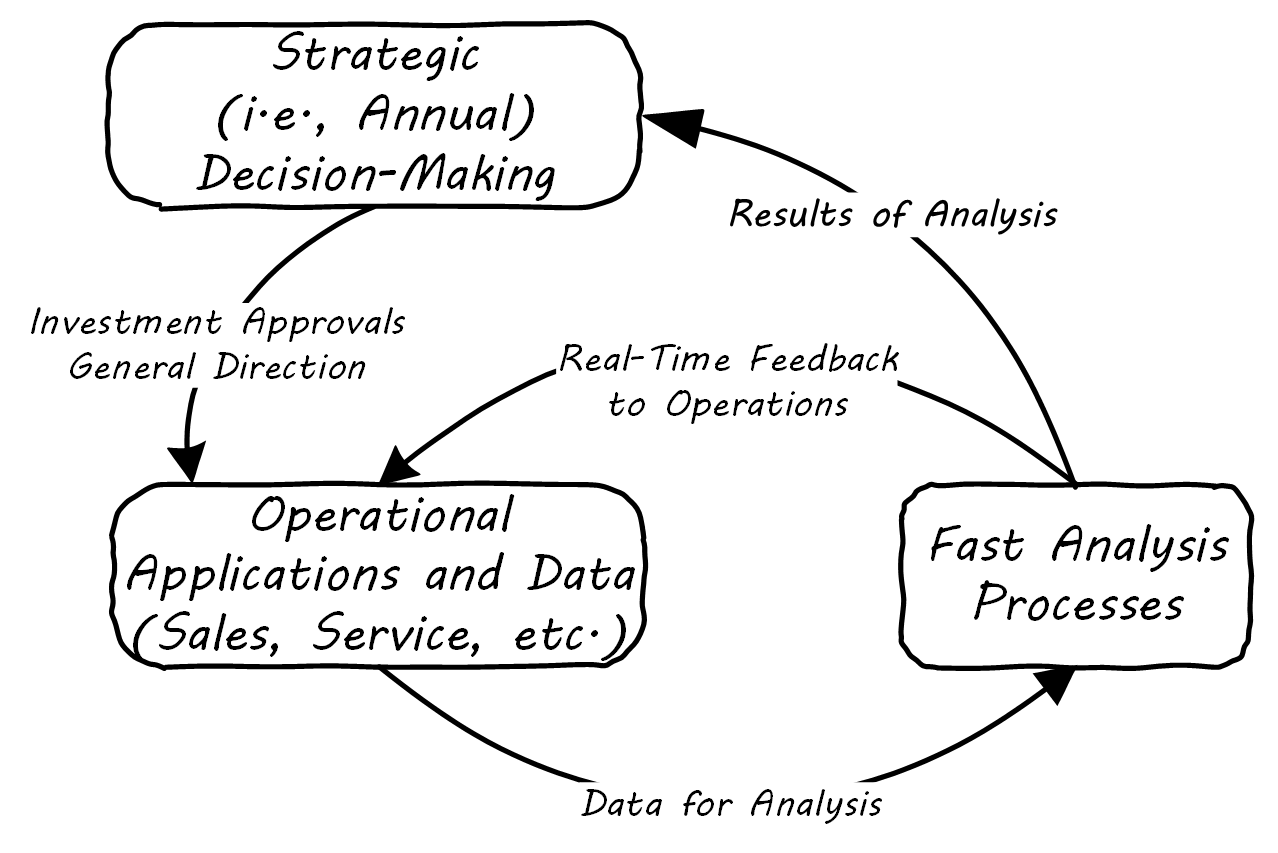
And, for certain applications (such as an online traffic management application on your smartphone), analytics is such a fundamental part of the application that it becomes operational. Such pervasive use of analytics is one of the hallmarks of Digital Transformation.
Data Warehousing and Business Intelligence
The reason to build a DW is to have the ability to make better decisions faster based on information using current and historical data. [Westerman 2014]
Data Warehousing: Using the Wal-Mart Model
According to the DMBOK, “A Data Warehouse (DW) is a combination of two primary components. The first is an integrated decision support database. The second is the related software programs used to collect, cleanse, transform, and store data from a variety of operational and external sources … Data warehousing is a technology solution supporting Business Intelligence (BI)” [DAMA 2010]. The vision of an integrated DW for decision support is compelling and has provided enough value to support an industry sector of specialized hardware, software, training, and consulting. It can be seen as a common architectural pattern, in which disparate data is aggregated and consolidated for purposes of analysis, reporting, and for feedback into strategy, tactics, and operational concerns.
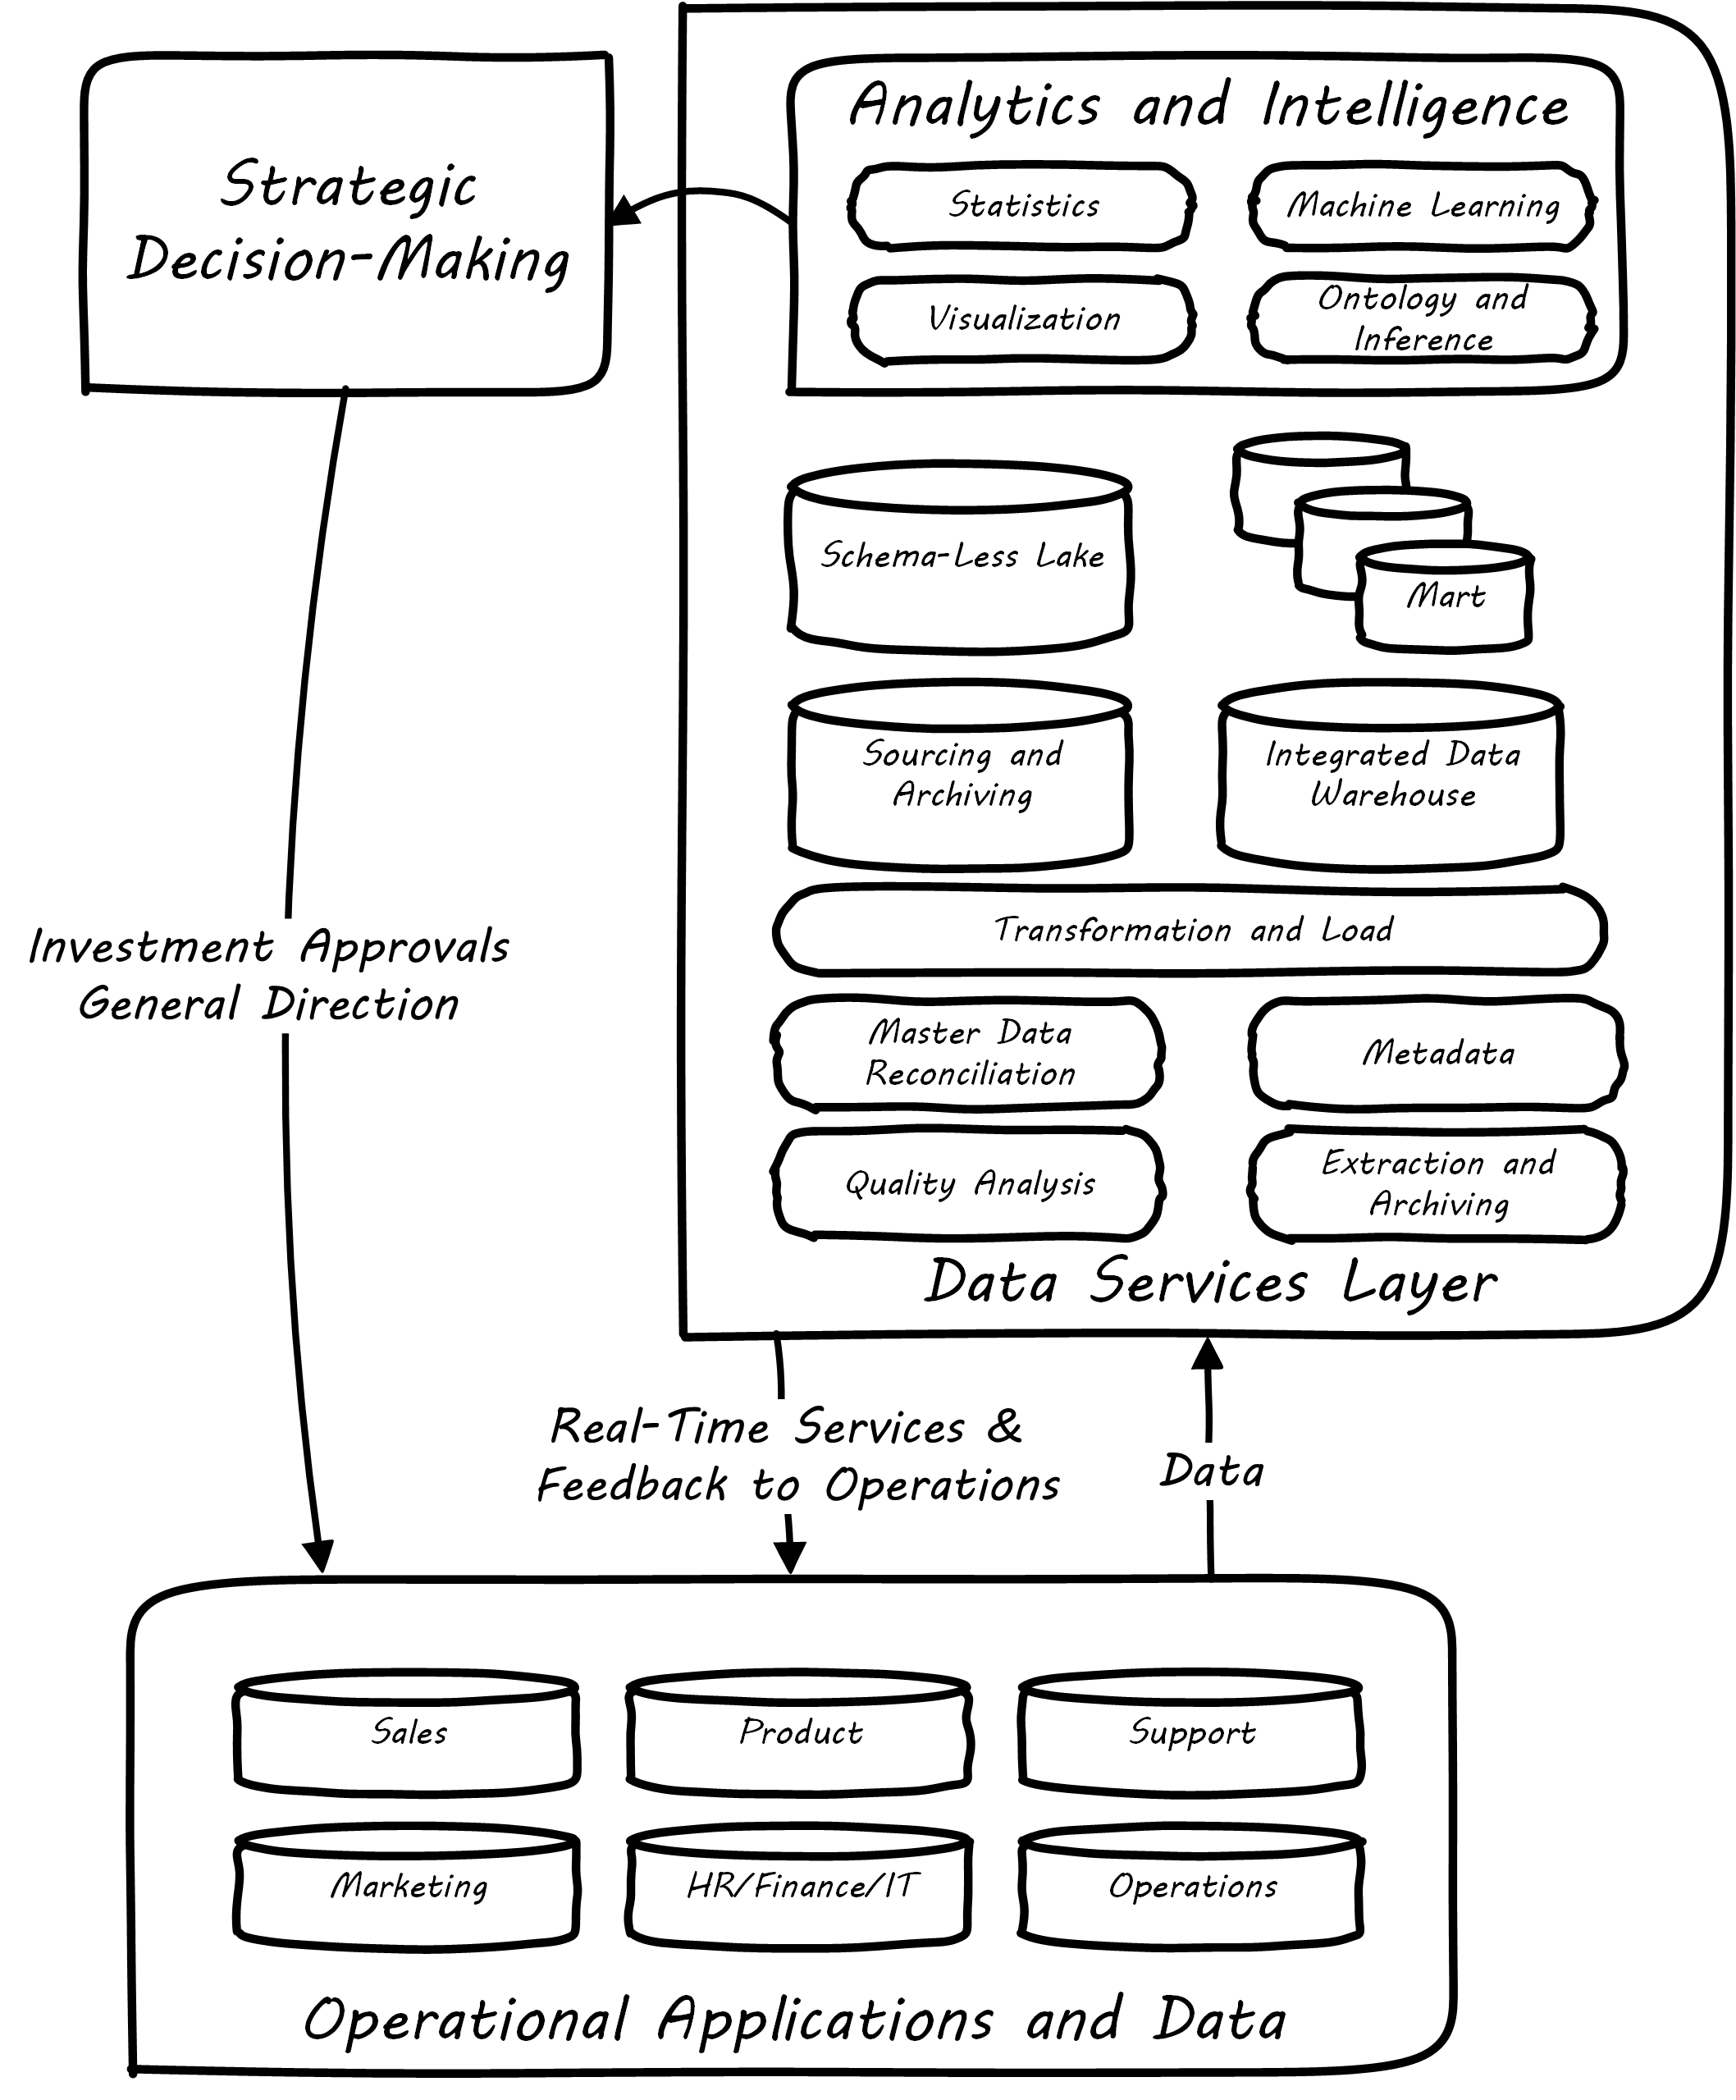
Data Warehousing/Business Intelligence Architecture illustrates a DW/BI implementation pattern. The diagram expands on the above contextual diagrams, showing the major business areas (sales, etc.) as data sources. (In a large organization this might be dozens or hundreds of source systems.) These systems feed a “data services layer” that both aggregates data for analytics, as well as providing direct services such as data cleansing and master data management.
It is important to understand that in terms of this document’s emphasis on product-centric development that the data services layer itself is an internal product. Some might call it more of a component than a feature, but it is intended in any case as a general-purpose platform that can support a wide variety of use-cases.
“Factoring out” data services in this way may or may not be optimal for any given organization, depending on maturity, business objectives, and a variety of other concerns. However, at scale, the skills and practices do become specialized, and so it is anticipated that we will continue to see implementation strategies similar to this figure. Notice also that the data services layer is not solely for analytics; it also supports direct operational services. Discussions of the various elements are shown in Data Warehousing/Business Intelligence Architecture.
-
“Operational Applications and Data”
These are the source systems that provide the data and require data services.
-
“Quality Analysis”
This is the capability to analyze data for consistency, integrity, and conformity with expectations, and to track associated metrics over time; see data quality.
-
“Extraction and Archiving”
As data storage has become less expensive, maintaining a historical record of data extracts in original format is seen more often in data warehousing. (This may use a schema-less data lake for implementation.)
-
“Master Data Reconciliation”
When master data exists in diverse locations (e.g., in multiple Systems of Record) the ability to reconcile and define the true or “golden” master may be required. This is useful directly to operational systems, as an online service (e.g., postal service address verification), and is also important when populating the DW or mart. Master data includes reference data, and in the data warehousing environment may be the basis for “dimensions”, a technical term for the ways data can be categorized for analytic purposes (e.g., retail categorizes sales by time, region, and product line). Maintaining a history of dimensions is a challenging topic; search on the “slowly changing dimension” problem for further information.
-
“Metadata”
Commonly understood as “data about data”, we have previously encountered the concept of metadata and will further discuss it in the next Competency Category.
-
“Transformation and Load”
Converting data to a consistent and normalized form has been the basis of enterprise data warehousing since it was first conceived. (We will discuss the schema-less data lake approach in the next Competency Category.) A broad market segment of “Extract, Transform, Load” (ETL) tooling exists to support this need.
-
“Sourcing and Archiving”
This represents the physical data store required for the extraction and archiving capability. Again, it may be implemented as a schema-less data lake, or as a traditional relational structure.
-
“Integrated Data Warehouse”
The integrated or enterprise DW is the classic, normalized, often massive, historical data store envisioned originally by Bill Inmon [Inmon 2005]. While the development effort in creating fully normalized DWs has limited them, they nevertheless are important, valuable, and frequently encountered in larger organizations.
-
"Schema-Less Lake”
A newer form of data aggregation is seen in the schema-less “data lake”. As discussed in the next Competency Category, schema-less approaches accept data in native formats and defer the hard question of normalizing the data to the reporting and analysis stage.
-
“Data Mart(s)”
The integrated DW is intended to provide a consistent and universal platform across the enterprise. The data mart on the other hand is usually seen as specific to a particular organization or problem.
-
“Statistics”
Statistical analysis of the aggregated and cleansed data is a common use-case, often performed using commercial software or the R programming language.
-
“Machine Learning”
Machine learning is broadly defined as “a field of study that gives computers the ability to learn without being explicitly programmed” (Arthur Samuel as quoted in Simon 2013). Machine learning allows computers to develop and improve algorithmic models for making predictions or decisions. Spam filters that “learn” are a good example.
-
“Visualization”
Representing complex information effectively so that humans can understand it and derive value is itself a challenging topic. Many graphical forms have been developed to communicate various aspects of data; see, for example, the open source visualization library D3.js.
-
“Ontology and Inference”
This includes text mining and analytics, and also the ability to infer meaning from unstructured data sets. More in the next Competency Category discussion on schema-less.
Evidence of Notability
Analytics and “Big Data”, and their more advanced expression in cognitive applications, are significant areas of R&D and industry interest.
Limitations
Analytics is a broad topic, ranging from simple reporting to AI. Clarity on what the term may mean in a given context is essential.
Related Topics